I Reviewed 17 Content Marketing Analytics Tools: Here’s Everything You Need to Know

Creating successful marketing campaigns and compelling content starts with understanding the numbers behind your strategies.
For me, content marketing analytics are like having a behind-the-scenes guide — they reveal what’s working, what’s not, and where there’s room to grow.
By using data effectively, I gauge the impact and success of my efforts. In this blog, I’ll walk you through some of the best tools I’ve come across for doing that.
But I’ll start by discussing why content marketing analytics are absolutely essential.
Table of Contents
What are content marketing analytics?
Content marketing analytics is the process of collecting and interpreting data related to your content marketing efforts, then using key performance indicators (KPIs) to measure the effectiveness of your campaigns.
Common metrics include page views, engagement rates, conversion rates, and organic traffic. You should measure the performance of your content across all platforms and channels. The result of your analysis will help you understand what types of content perform best and how to distribute it.
The data is super important because you can use it to inform your future strategy.
Why are content marketing analytics important?
The days of simply writing a blog post, targeting a few keywords, hitting publish, and hoping for the best are long gone.
Although ranking content on the first page of Google is still a goal for many companies, content marketing analytics go beyond just blog posts.
Social media posts, video scripts, and email newsletters all rely on effective content to drive engagement and conversions. Even PR efforts, such as measuring the quality of media coverage, cost-efficiency, and conversion rates, are deeply tied to the effectiveness of the content being shared.
Content marketing analytics are important for the following reasons.
Evaluating Campaign Performance
Content marketing analytics offer actionable insights that empower data-driven decision-making. By tracking key metrics with tools like Google Analytics, you can pinpoint the strengths and weaknesses of your current strategy.
This includes identifying which types of content resonate most, which platforms yield the best results, and the ideal times to engage your audience on social media.
By analyzing metrics, I gain a deeper understanding of how my audience interacts with various types of content. To run a successful campaign, I suggest doing less and measuring more.
Measuring Progress Towards Goals
A dashboard is a powerful tool for getting data in one place and making sense of the analysis. With a dashboard open in front of me, I ask insightful questions such as:
- Why do some metrics consistently rise or fall?
- Are certain metrics correlating by chance, or is there a cause-and-effect relationship at play?
- Which metrics reflect actual consumer behavior?
The answers then provide a clear picture of the audience’s true preferences and actions.
Basically, content marketing analytics makes it easier to spot trends and patterns.
Helping Create Better Strategies
Effectively leveraging content marketing analytics to evaluate campaigns serves two key purposes:
- It allows me to craft content strategies that resonate deeply with my audience.
- It helps me make more persuasive pitches (something I find valuable when offering content marketing services to clients).
This data empowers me to experiment and refine my approach. It also allows me to observe shifts in performance and to frame effective future strategies. I recommend going through this free data analytics guide to equip yourself with more knowledge on the topic.
How to Use Content Marketing Analytics Data
I’ve been tracking content marketing performance for a client to measure its effectiveness. By analyzing key metrics, I’ve been able to uncover valuable insights that guide our content strategy.
Our strategy revolves around repurposing existing blog content into engaging social media posts. We began by sharing niche-relevant content on the personal LinkedIn profile of the company’s CEO. We used a content marketing tool to gather performance data.
I then organized the data in a simple Excel sheet. I am a fan of Excel as I could write down the topic of the post and its relevant data in front. This way, I was able to do a better comparison of performance with other topics (see screenshots below).
Using this approach, I was able to identify which posts resonated with the audience and which ones fell short. The idea was to use this data to fine-tune our content marketing strategy for better results.
I’ve broken down the process of using content marketing data into three clear sections. While you’re welcome to draw inspiration from my approach, feel free to adapt it to suit your needs.
Tracking Content Details
I typically update the spreadsheet with metrics about two weeks after a post goes live, ensuring there’s enough data to analyze its performance effectively.
I include the post URL in the spreadsheet for quick and convenient access whenever needed.

Alongside this, I record the date and time the post was published. Tracking the posting time provides an additional layer of insight, allowing me to evaluate how timing influences engagement levels.
Tracking Metrics
I document key metrics for each post, including impressions, reactions, comments, and reposts.

Whenever I notice a spike in impressions, I can easily check which topics are performing better. Remember, the idea is to use data to identify patterns and insights to guide future content strategies.

For posts featuring videos, I recorded both the number of views and the total minutes watched for each video. The total engagement and the engagement rate fields are automatically calculated in Excel. I use the following formulae:
Total Engagements = SUM (Reactions + Comments + Reposts)
Engagement Rate = Total Engagements / Impressions
Tracking Audience Engagement
This aspect is perhaps the most impactful when it comes to making the most out of your data. I get the post-analytics data from Shield, which appears as follows:
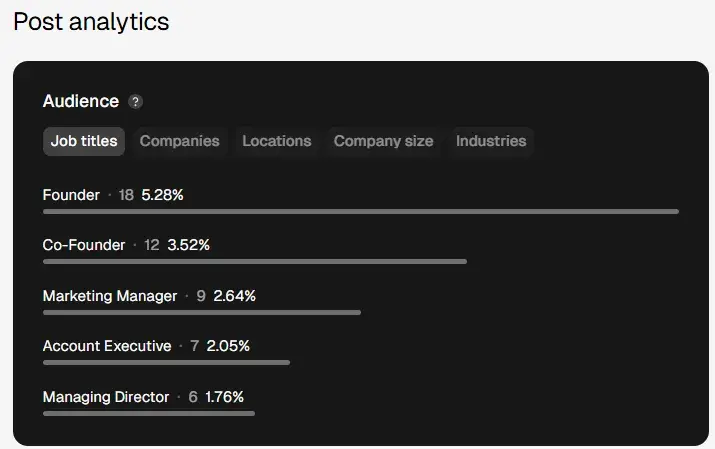
For instance, when targeting individuals in the marketing field, I make a note of the job titles of those who fit our target audience and have interacted with the post.
Similarly, by clicking on the “Industries” section, I can identify the sectors of those engaging with the content. If an industry falls within our target audience, I note it down along with its corresponding percentage.

Note: The Shield app’s post analytics also provide data on company names, locations, and company size. However, I did not include this information in the Excel sheet, as it wasn’t directly relevant to our analysis.
My Learnings
I found this data tracking method to be highly effective, not just for its simplicity but also because it allowed our team to make data-driven recommendations to the client. When planning future posts and presenting ideas, we could base our strategy on actual performance metrics.
For example, if a particular hook outperformed previous ones, the content strategist could think of similar hooks when writing content for future posts.
Similarly, by analyzing the topics that garnered the most engagement, I reverse-engineered the framework used for that particular post. The idea is that this data helps in replicating the success for future content and discarding the framework or ideas that did not work.
If you’d prefer not to do all the manual data entry, check out the tools I tested below.
There are a number of marketing analytics tools available with customizable metrics, a variety of visualizations and dashboards, and integrations to help you measure the impact of your marketing strategy.
Let’s dive into the best options.
1. HubSpot Marketing Analytics and Dashboard Software
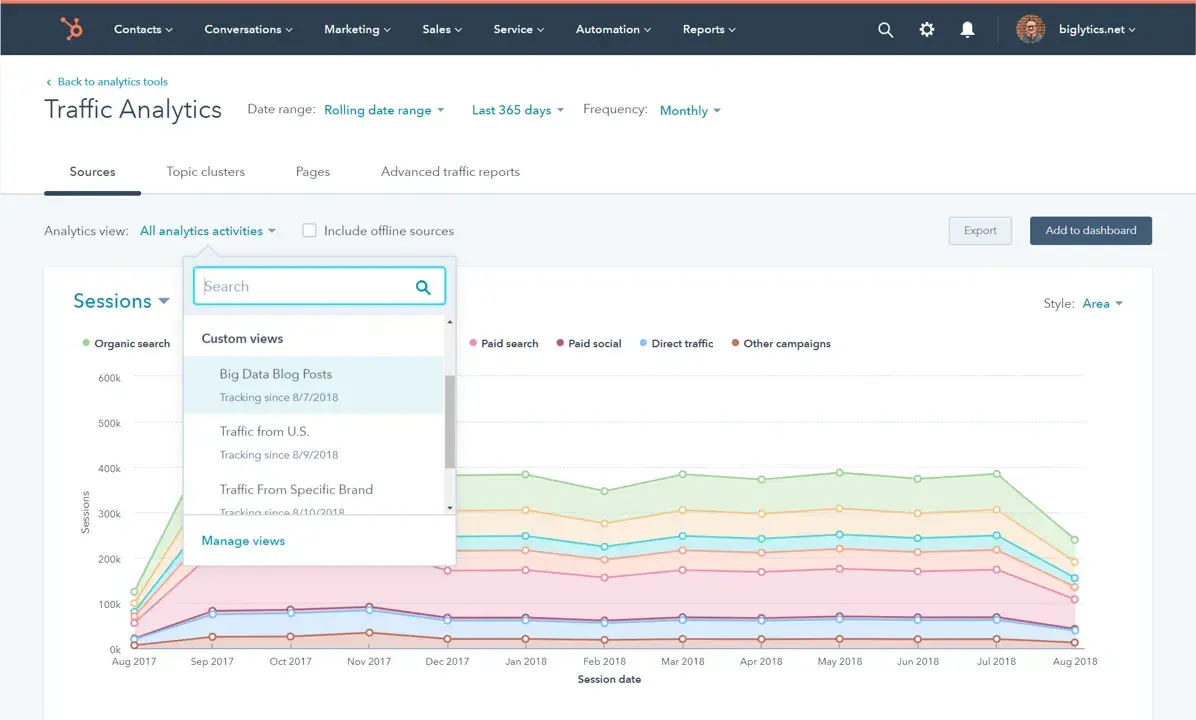
Best for: Measuring the performance of all your campaigns and combining resulting data with your CRM platform.
What I Like About HubSpot Marketing Analytics and Dashboard Software
- Centralized Insights. I love how all the data and insights are accessible from one location. No more hopping between platforms; I can get the information I need in seconds.
- Custom Behavioral Tracking. The ability to trigger or schedule touchpoints and track interactions unique to my business is a game-changer. I appreciate that it conveniently highlights when a customer is ready to move to the next stage of the buyer’s journey.
- Attribution Reporting. It connects every customer interaction to its associated record and revenue generated. It helps me see exactly which efforts are paying off and which need tweaking.
- Visual Data Dashboards. The pre-built and customizable dashboards (including Custom Objects) make it easy to visualize data. I am able to use workflows to quickly transform insights into actionable strategies for my segments and campaigns.
In essence, HubSpot makes marketing analytics feel less like a chore and more like a strategic advantage.
Price
There are four Marketing Hub plans with different analytics features and flexibility ranging in price from free (forever) to $3,600 per month.
2. Buffer
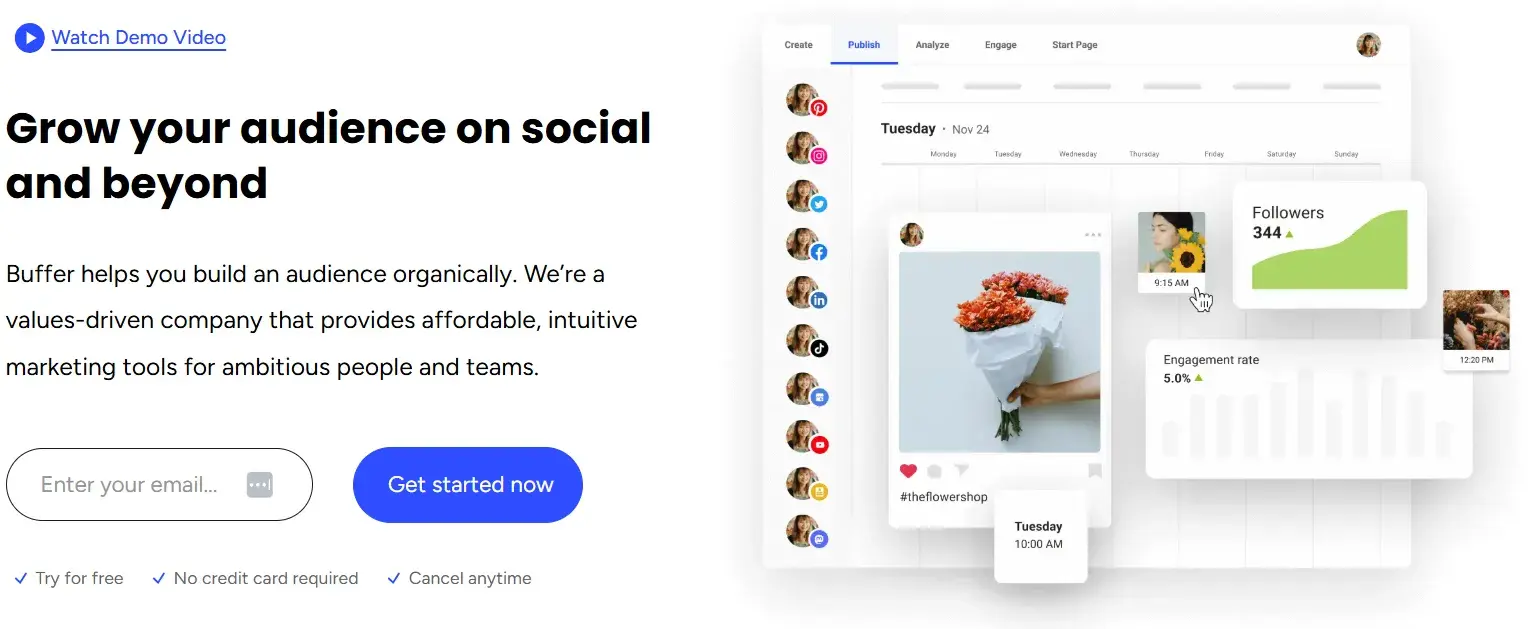
Best for: Understanding channel performance in detail with customizable reports.
What I Like About Buffer
Buffer is a fantastic content marketing analytics tool for digging deep into social media performance. Here are some interesting features:
- Effortless Sharing. Exporting reports is a breeze — which is great, especially when it’s required to share insights regularly with stakeholders.
- Daily Updates. Knowing that the reports are updated daily gives me confidence that I’m always working with the latest and most accurate data.
- Comprehensive Dashboard. Buffer’s single dashboard view is a time-saver. It offers a detailed breakdown of channel performance, so I can quickly assess what’s working and what needs adjustment.
- Engagement Insights. The platform provides engagement metrics for each social account individually. This helps in understanding how customers interact with posts, stories, and hashtags and how audience demographics vary across channels.
- Social Media Management. I like how all the social media platforms are consolidated in one place in this app. This makes posting very effective.
Price
Buffer’s Marketing Analytics product has three payment options with different features and flexibilities.
- Free
- Essentials - $5/month
- Teams - $10/month
3. Google Analytics
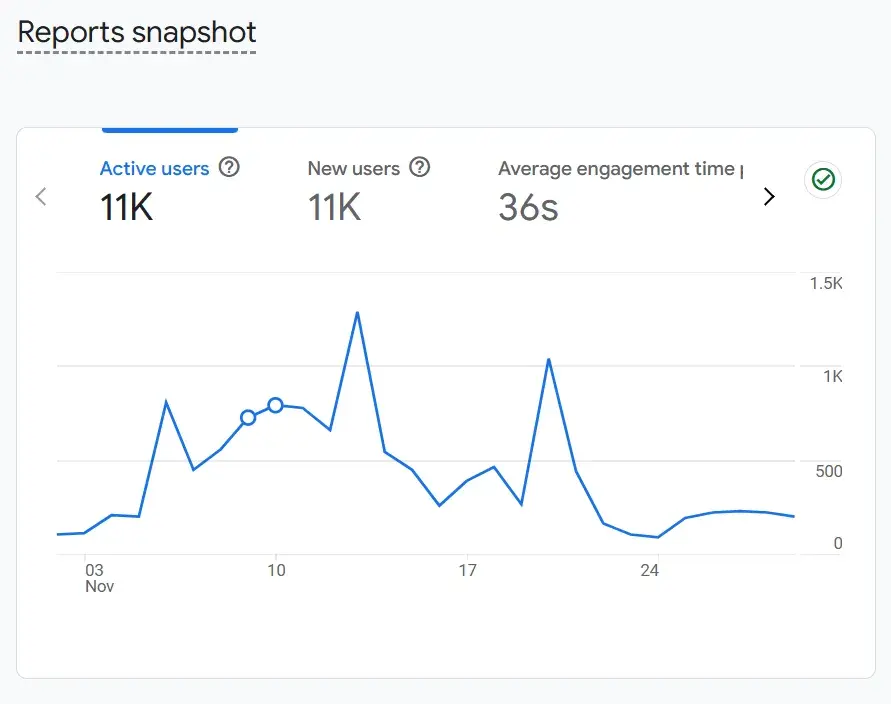
Best for: Integrating content marketing analytics seamlessly with other Google business tools and making data-driven strategic decisions.
What I Like About Google Analytics
Here’s what I appreciate about Google Analytics:
- Intuitive Interface. Navigating Google Analytics is straightforward, even for beginners. It’s designed to help quickly understand how content is performing across multiple platforms.
- Granular Analysis Options. I love that I can analyze my content’s performance either across my entire website or drill down to individual pages. This flexibility allows you to pinpoint which areas need improvement.
- Comprehensive Metrics. The tool provides a wealth of data on traffic, navigation patterns, conversions, and organic search performance.
- User-Level Insights. Allows tracking user-level interactions that give me a clear picture of how the audience is engaging with my content.
- Seamless Integration. The integration with other Google business tools is a big plus. It’s incredibly convenient to access all my data and insights without needing to switch between platforms.
Price
Google Analytics offers a free and a paid plan. The free plan is ideal for SMBs, and you can get started using it immediately. Meanwhile, the paid plan, called Analytics 360, is ideal for enterprise-level companies and requires you to speak with a sales rep for a quote.
4. SimilarWeb
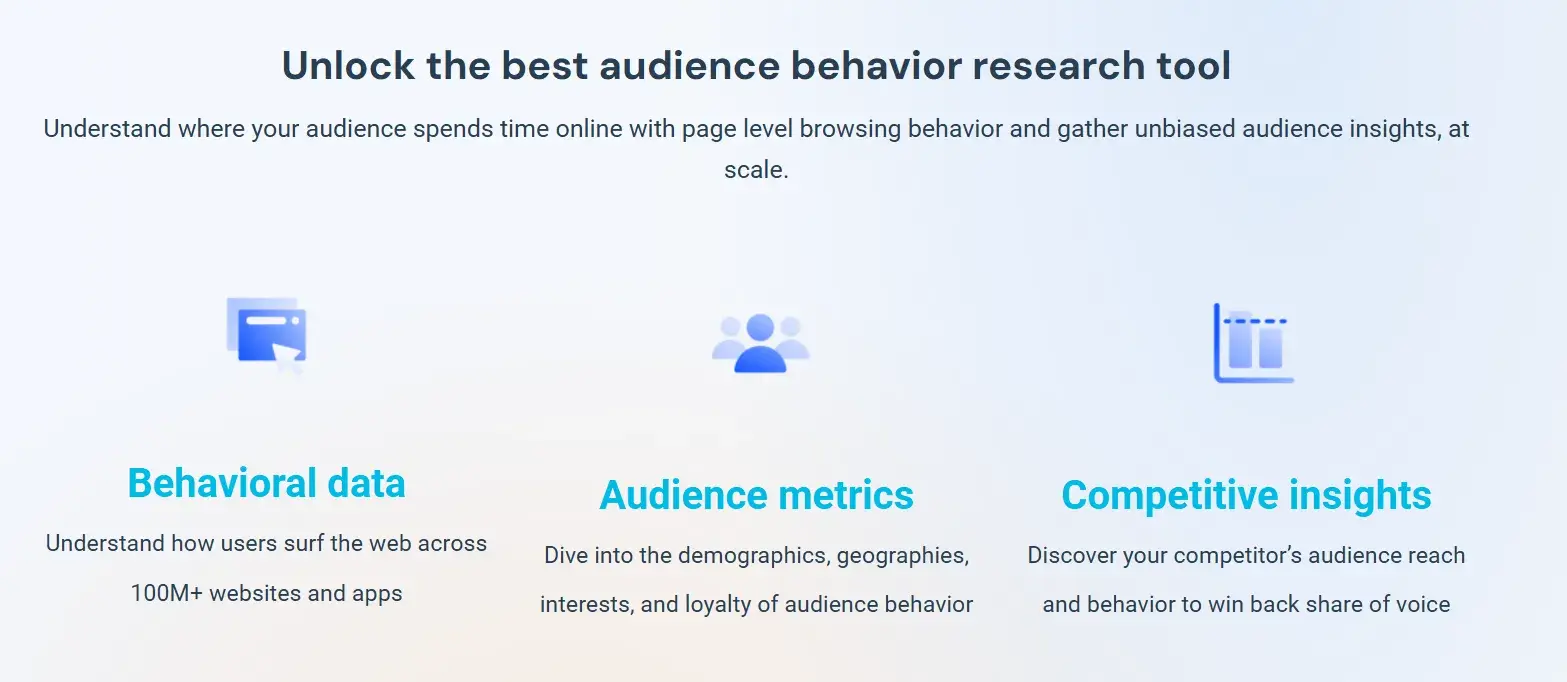
Best for: Understanding where your website and content strategy stand in comparison to industry standards.
What I Like About SimilarWeb
SimilarWeb has the following benefits:
- Competitive Insights. Provides detailed traffic and engagement metrics that show exactly where my website stands compared to others in my industry. It’s invaluable for assessing performance and identifying areas to improve.
- Comprehensive Metrics. Gives key metrics such as daily active users, sessions per user, use-time, and rank. It also helps uncover more about the audience, such as their repetitive behaviors and interests.
Price
- Starter - $199/month
- Professional - $449/month
5. Semrush
Best for: Tracking SEO and keyword performance across your web pages and content strategy.
What I Like About Semrush
Semrush is an essential tool for managing and improving the SEO strategy. Here’s what makes it so effective:
- Keyword Ideas. When I look for a search term in Semrush, it gives me options for a lot of secondary keywords that I didn’t think of initially. These options are usually low-hanging fruit, and they are perfect for staying ahead in search rankings.
- Domain Overview. I can essentially get information about any competitor just by adding the website domain. It provides insights into their organic search traffic, top-performing keywords, and even backlink profiles.
- Content Gap Analysis. One of my favorite features is the “Keyword Gap” feature that gives me the ability to compare the website I’m analyzing against competitors to see which keywords they rank for that this particular website doesn’t. I also do the same for backlinks by using the “Backlink Gap” feature.
Price
Semrush offers three plans that range in price from $119 to $449 per month.
6. Hotjar
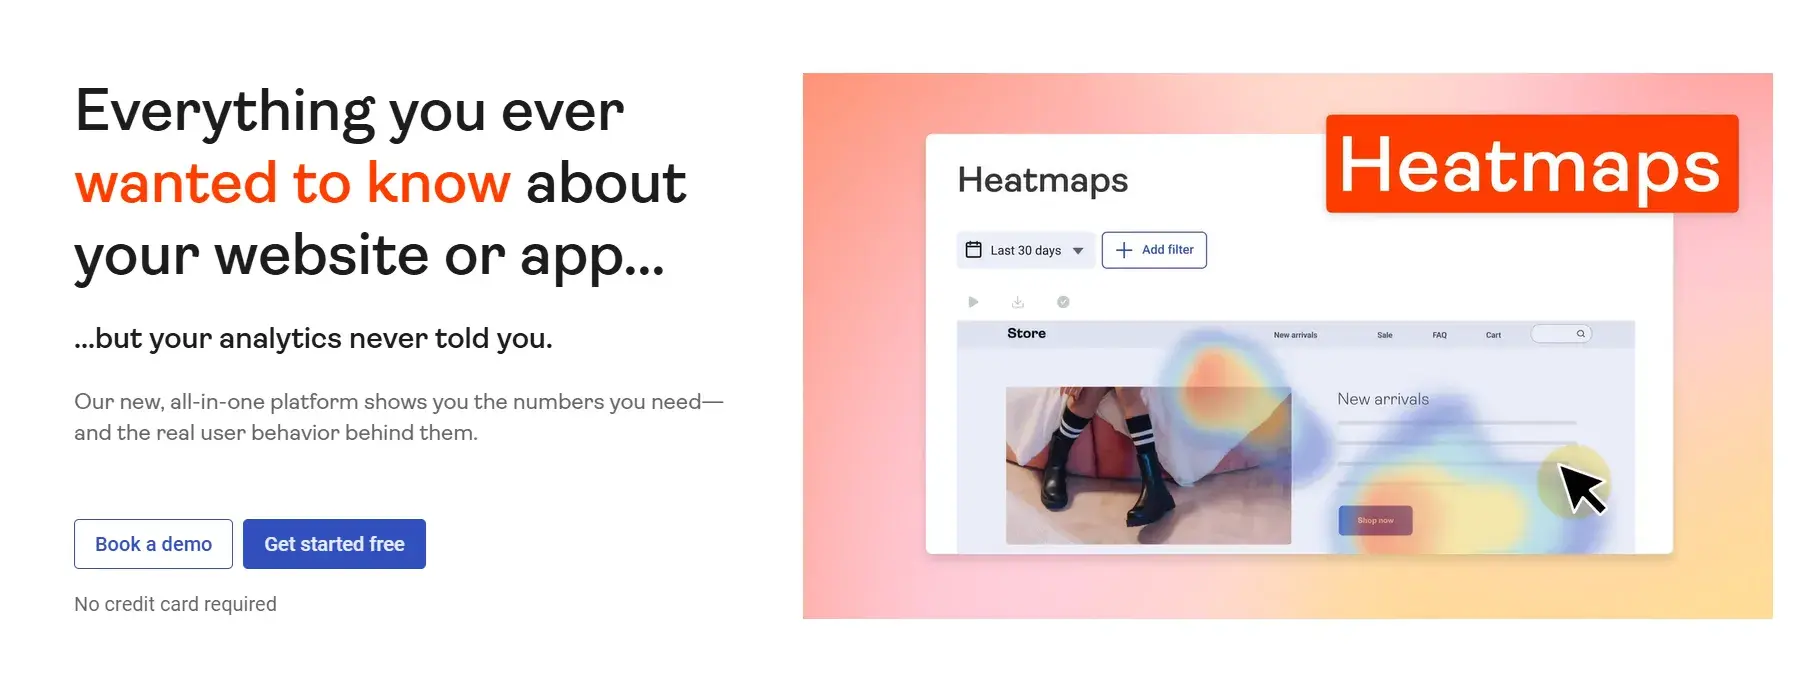
Best for: Tracking and visualizing sessions on websites with heat maps.
What I Like About Hotjar
Hotjar is an incredible tool for understanding how visitors interact with my website. Here’s why I think it’s worth using:
- Heat Maps. I love the heat maps feature — it visually shows me exactly where customers spend their time on the website. I can easily pinpoint the most engaging content and areas that need improvement.
- Session Recordings. The real-time videos are a game-changer. Watching how visitors navigate the site gives me deep insights into their behavior and what captures their attention.
- Conversion Tracking. It is easy to track conversions and identify patterns in the buyer’s journey. I can quickly see which stages customers might be entering or leaving, allowing me to optimize the journey for better results.
Price
- Free
- Plus - $39/month
- Business - $99/month
- Scale - $213/month
All of these prices become a bit lower if you choose the annual billing option.
7. Moz
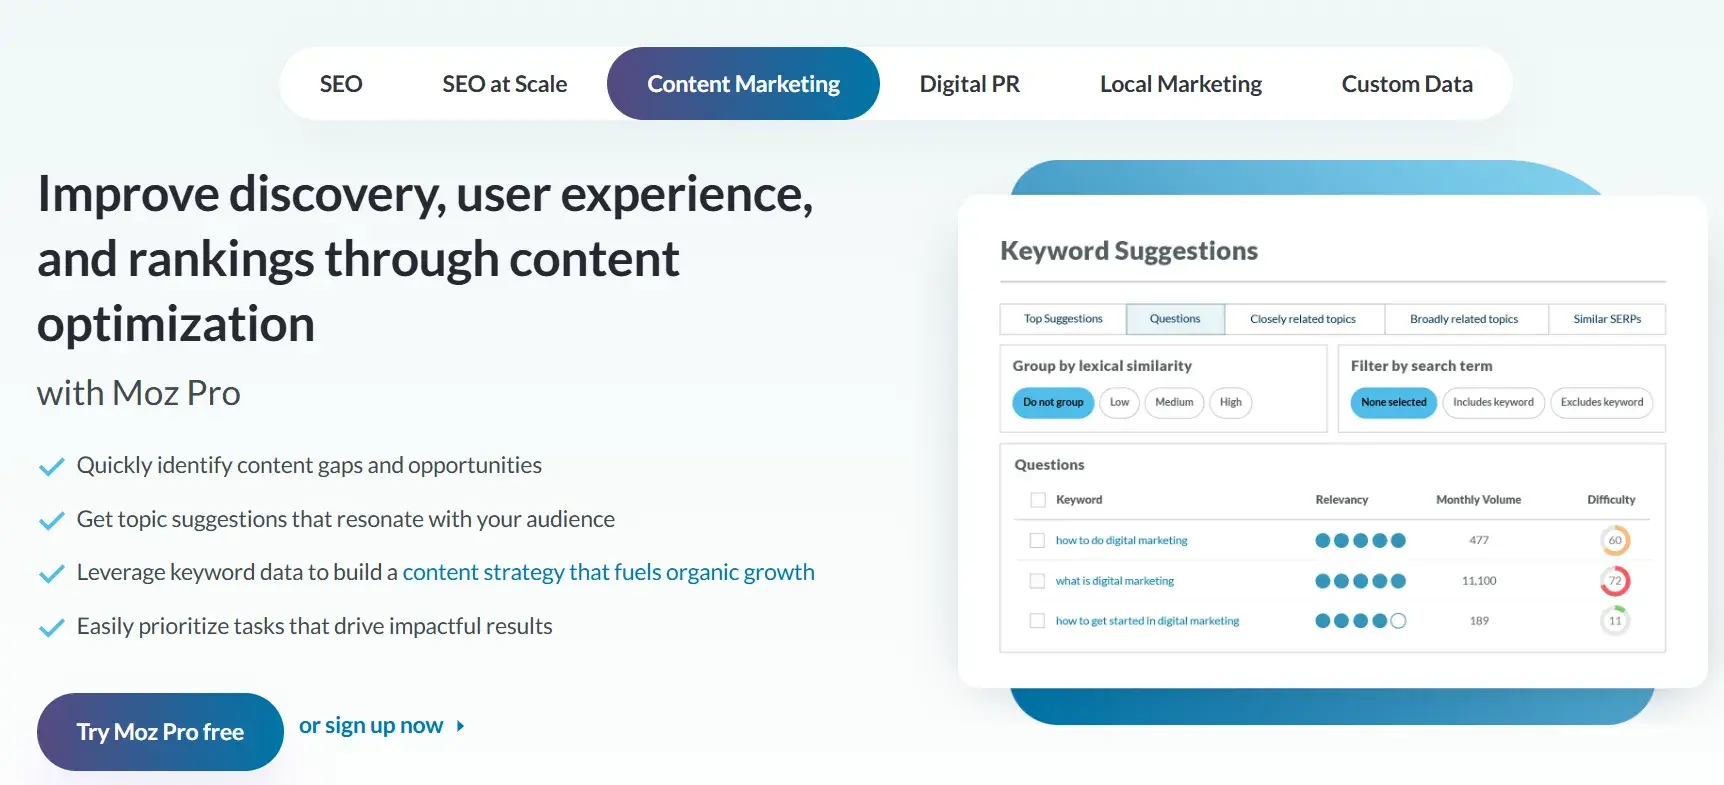
Best for: Measuring your SEO content strategy and determining which keywords you should be using.
What I Like About Moz
Moz is my go-to tool for optimizing SEO content strategy. Here’s what stands out about it:
- Keyword Insights. Moz gives me a clear understanding of which keywords are most effective.
- Rank Tracking. I love how Moz tracks a website’s keyword rank and visibility over time. It highlights what’s working and what needs improvement — which helps you make informed adjustments.
- Competitive Analysis. Similar to Semrush, Moz gives the ability to track how competitors rank on SERPs. It’s a great way to spot opportunities to improve and find gaps in content.
- Detailed Reporting. Moz’s reports are incredibly thorough. They show how my content is performing, share well I’m reaching my audience, and provide actionable recommendations to enhance results.
Price
- Local - $14/month
- Pro - $99/month
- Stat - $720/month
8. Parse.ly
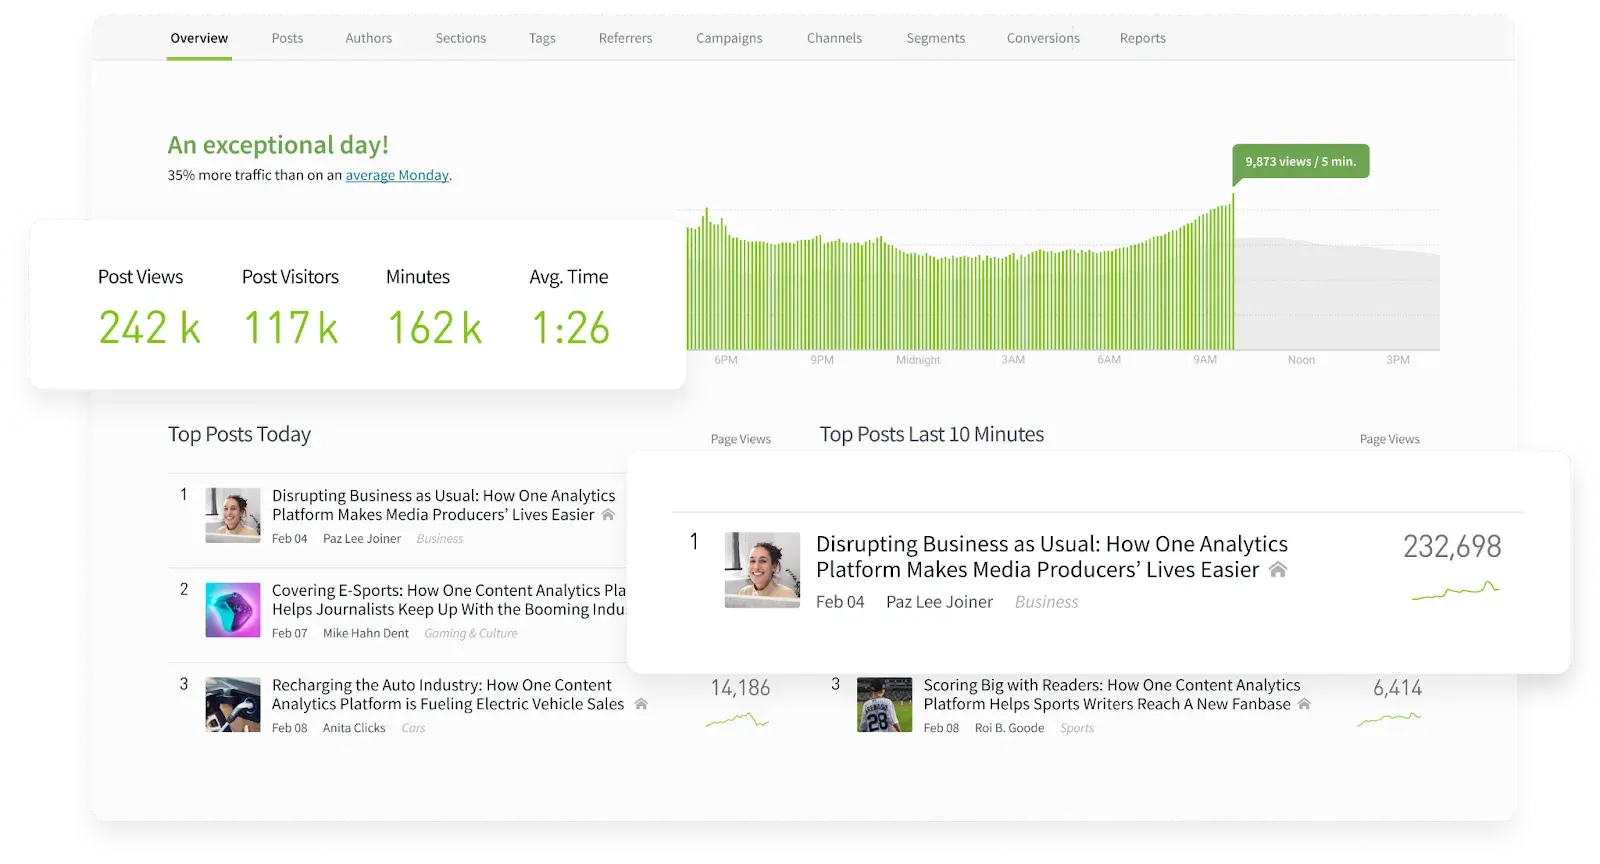
Best for: Making it easy for the whole team to understand how content drives business.
What I Like About Parse.ly
Parse.ly is a fantastic tool for content-driven teams, and here’s why I’d recommend it:
- User-Friendly for Everyone. Unlike more complex platforms, Parse.ly is built to be accessible to everyone on the team, even those who aren’t data experts.
- Clear Content Insights. Parse.ly simplifies data and focuses on what matters — showing how content drives traffic, conversions, and overall ROI. It makes proving the value of my efforts a breeze.
- Optimized Distribution. The tool helps me optimize how I distribute content across channels, ensuring it reaches the right audience in the most effective way.
Parse.ly makes understanding and acting on content performance straightforward, empowering teams to create strategies that drive real business results.
Price
Parse.ly requests potential buyers to book a demo for getting a custom quote and selecting the right plan for their company.
9. Quintly
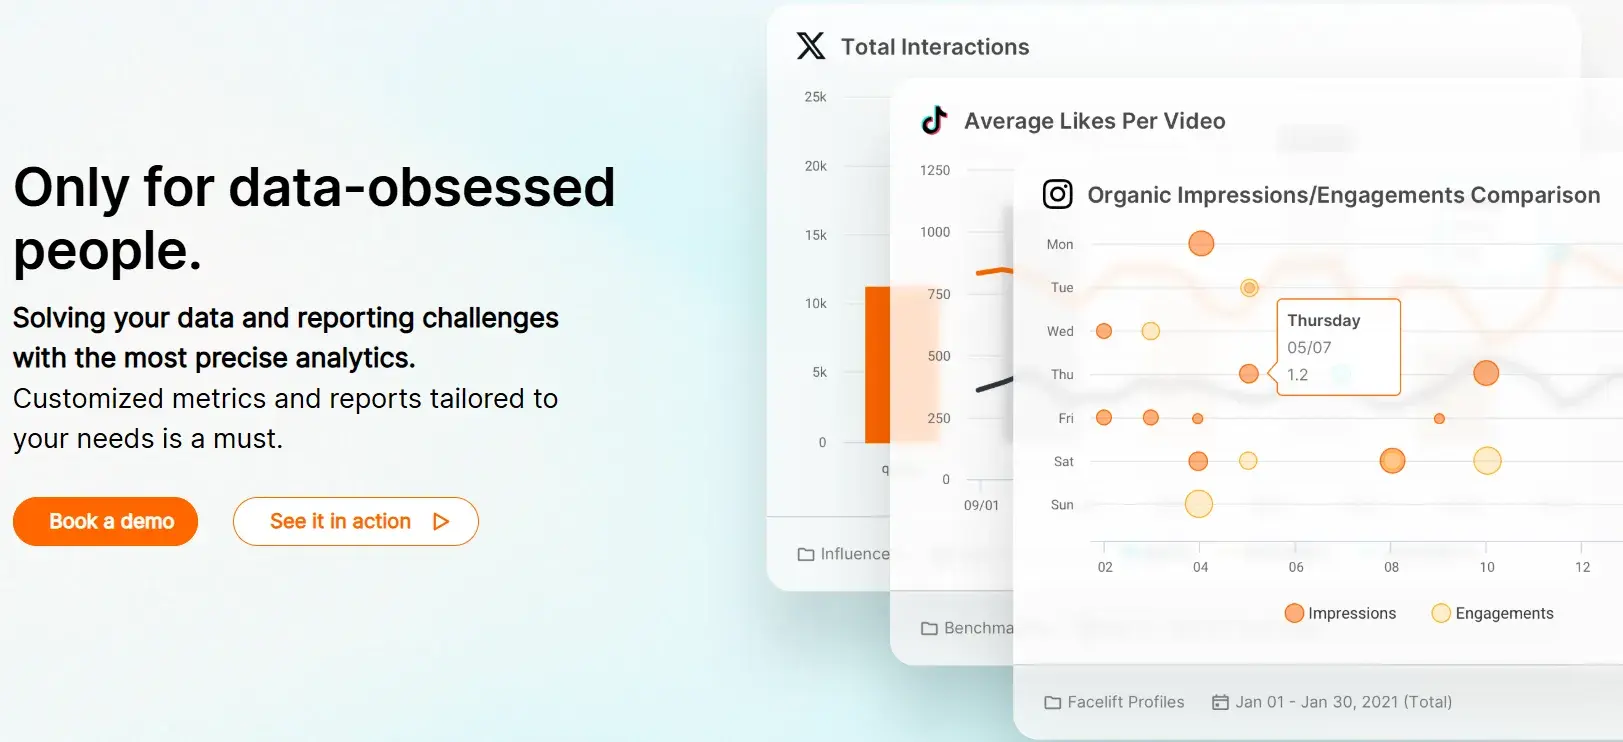
Best for: Improving social planning by analyzing the success of your social media marketing strategy with customizable metrics.
What I Like About Quintly
Quintly is a powerful tool for taking social media marketing strategies to the next level. Here’s why it stands out for me:
- Customizable Metrics. I love that Quintly allows me to tailor metrics to align with my specific goals. It’s invaluable for analyzing campaigns and making smarter decisions about social planning.
- Automated Reports. Quintly’s automation feature is a big time-saver. It generates reports and measures their impact using a machine learning system, making data analysis seamless.
- API Integration. With API access and integration with tools like Google Search, Quintly helps in overcoming data silos and getting a holistic view of performance.
Price
Quintly’s pricing is available on request.
10. BuzzSumo

Best for: Visualizing and analyzing real-time marketing trends to tailor content to your target audience.
What I Like About BuzzSumo
BuzzSumo is my go-to tool for staying on top of marketing trends. Here’s why I find it so valuable:
- Real-Time Trend Analysis. I love how BuzzSumo lets me view and analyze marketing trends in real time. It helps me stay ahead by identifying what’s likely to resonate with my audience right now.
- Location-Based Trends. The ability to filter trends by location is incredibly useful. It helps in understanding what’s popular in different regions, making my content more tailored and relevant.
- Customizable Feed. With a customized feed, I can cut through the noise and focus on the data that matters most to my strategy.
- Content Inspiration. The tool shows successful content examples, making it easy to spot proven strategies and identify relevant keywords to include in campaigns.
Price
- Content Creation - $199/month
- PR & Comms - $299/month
- Suite - $499/month
- Enterprise - $999/month
11. Kissmetrics
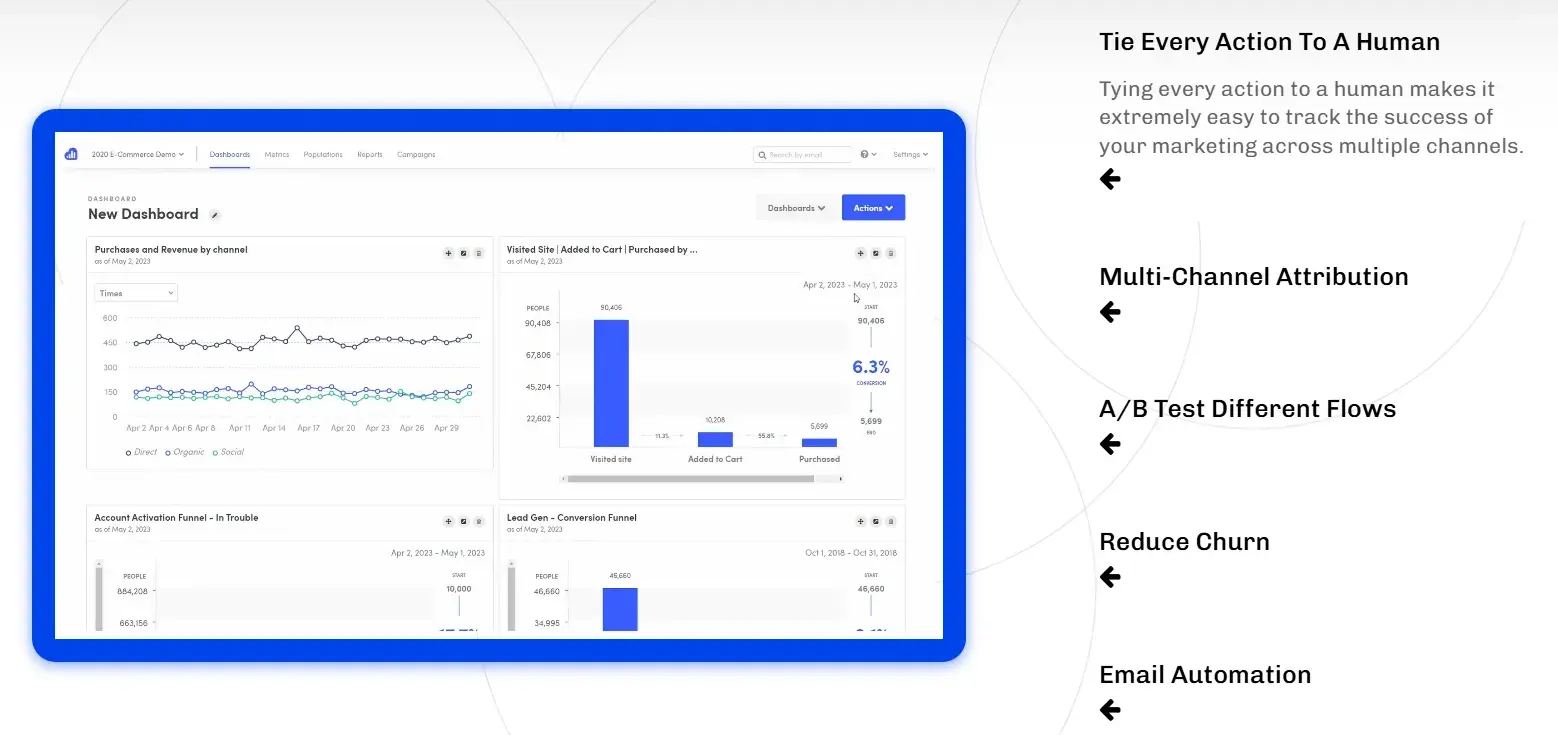
Best for: Discovering how your audience interacts with your website/apps and understanding their behaviors.
What I Like About Kissmetrics
Here’s why I suggest checking out the tool:
- Journey Tracking. I love how Kissmetrics lets me track a customer’s journey across multiple devices. This gives me a complete picture of how they interact with my website and apps.
- Behavioral Insights. Offers a deep dive into how customers engage with content, giving valuable insights into what resonates most with them.
- Conversion Metrics. Provides detailed conversion metrics such as bounce rate and time-on-site.
Kissmetrics is perfect for refining content strategies and improving user retention by understanding what truly matters to your audience.
Price
The SaaS plan comes with four payment options — those plans are $299, $499, or a custom price (based on your custom plan).
12. Databox
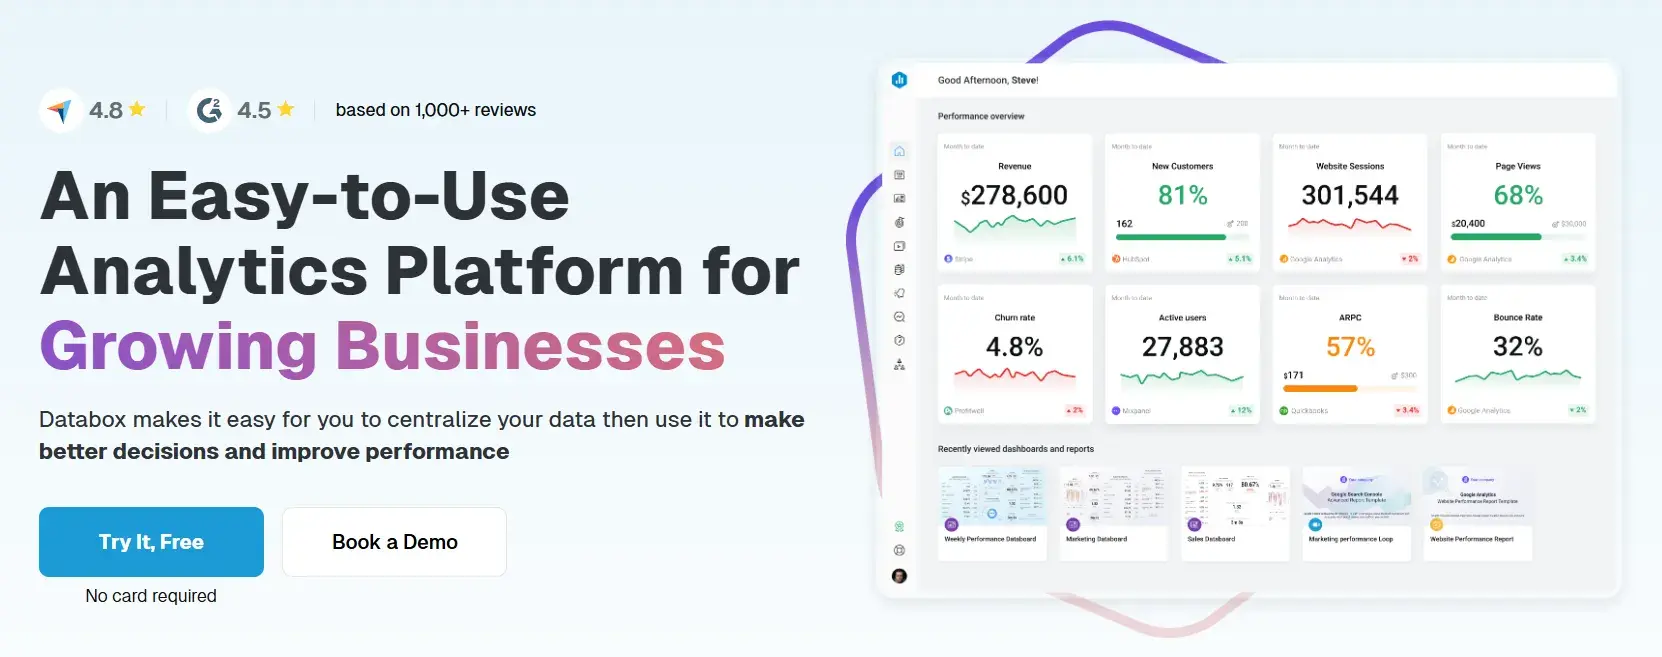
Best for: Combining all of your marketing data to track and understand the success of your strategy in a single location and in real time.
What I Like About Databox
I recommend Databox to anyone who wants a centralized way to track their marketing performance. Here’s why I think it’s a great tool:
- All-in-One Dashboard. Makes performance tracking easy by organizing all business data into a single location.
- Extensive Integrations. It offers over 70 integrations to bring in data, display it visually, and share insights seamlessly.
- Goal Tracking. The SMART goals feature is a personal favorite of mine. It lets you track your progress toward specific targets, helping you stay on top of your objectives.
- Scorecards & Alerts. The tool sends daily, weekly, or monthly updates on your KPIs. Plus, the real-time alerts ensure you can quickly act on any irregularities in your data.
Price
- Free Forever
- Starter - $59/month
- Professional - $199/month
- Growth - $399/month
13. Supermetrics
Best for: Taking marketing data from any source and moving it into Google Sheets, Google Data Studio, Microsoft Excel, Google BigQuery, or Snowflake for analysis.
What I Like About Supermetrics
If you want a powerful way to centralize and analyze your marketing data, Supermetrics is a fantastic choice. Here’s why:
- Data Integration from Any Source. Simplifies the process of pulling data from diverse sources like SEO, PPC, social media, and web analytics tools.
- Robust Reporting & Analytics. Serves as an all-in-one reporting, analytics, and data storage solution — especially invaluable for marketers focused on performance metrics.
- Versatile Export Options. Easily move data into platforms such as Google Sheets, Google Data Studio, Microsoft Excel, Google BigQuery, or Snowflake for further analysis.
- HubSpot Integration. The integration with HubSpot is an excellent bonus, especially if you’re already using HubSpot for your marketing efforts.
Price
Supermetrics and HubSpot Integration: Business Performance Tracking
Supermetrics has several products, so pricing differs depending on the product you opt for. For instance, if you are looking to move your data to any of Google Sheets, Microsoft Excel, Looker Studio, and Power BI, the starting price is $29/month.
If you’re looking to get the Supermetrics API or use any of Snowflake, Azure, BigQuery, Google Cloud Storage, you are prompted to fill out a form to request pricing.
14. Demand Sage

Best for: Moving all of your HubSpot data into Google Sheets for easy analysis in your platform of choice.
What I Like About Demand Sage
Here’s what makes Demand Sage so helpful:
- Seamless Data Sync. With just one click, Demand Sage pulls all your HubSpot data into Google Sheets. It’s fast, efficient, and hassle-free.
- Customizable Reporting. I love the flexibility of one-click, customizable reports that highlight key insights about marketing and sales performance.
- Granular Analysis. The table builder and record-level reporting lets you create highly detailed views tailored to your specific needs, directly within your spreadsheet.
- Attribution and Revenue Insights. Demand Sage connects marketing and sales data in meaningful ways. It offers a clear view of pipeline performance and what’s driving revenue.
If you’re using HubSpot and need an intuitive way to analyze your data in Google Sheets, Demand Sage is a no-brainer.
Price
Demand Sage’s basic plan is free. When I checked out the Premium plan, I was prompted to reach out to a sales representative for more information.
15. Grow.com
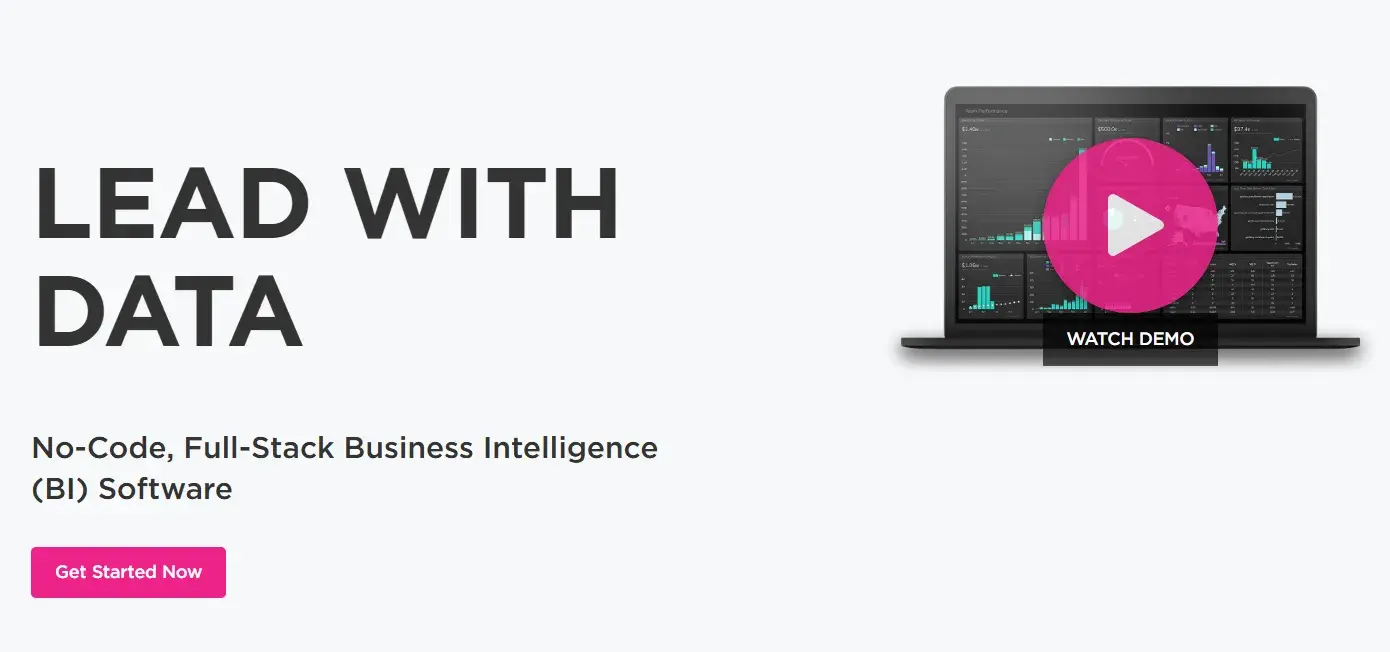
Best for: Importing and transforming business data from a variety of sources and then combining that data on custom dashboards.
What I Like About Grow.com
- Data Visualization Flexibility. I can select from a variety of chart types to visualize my data in the way that makes the most sense for me and my team. This flexibility ensures that we always get a clear view of our performance.
- Collaborative Sharing. The ability to share metrics and dashboards with my team ensures that everyone is aligned on where to focus efforts — something that’s key for driving results.
Price
Get a free Grow.com demo and talk to a rep about the price of the right plan for your business.
16. Plecto
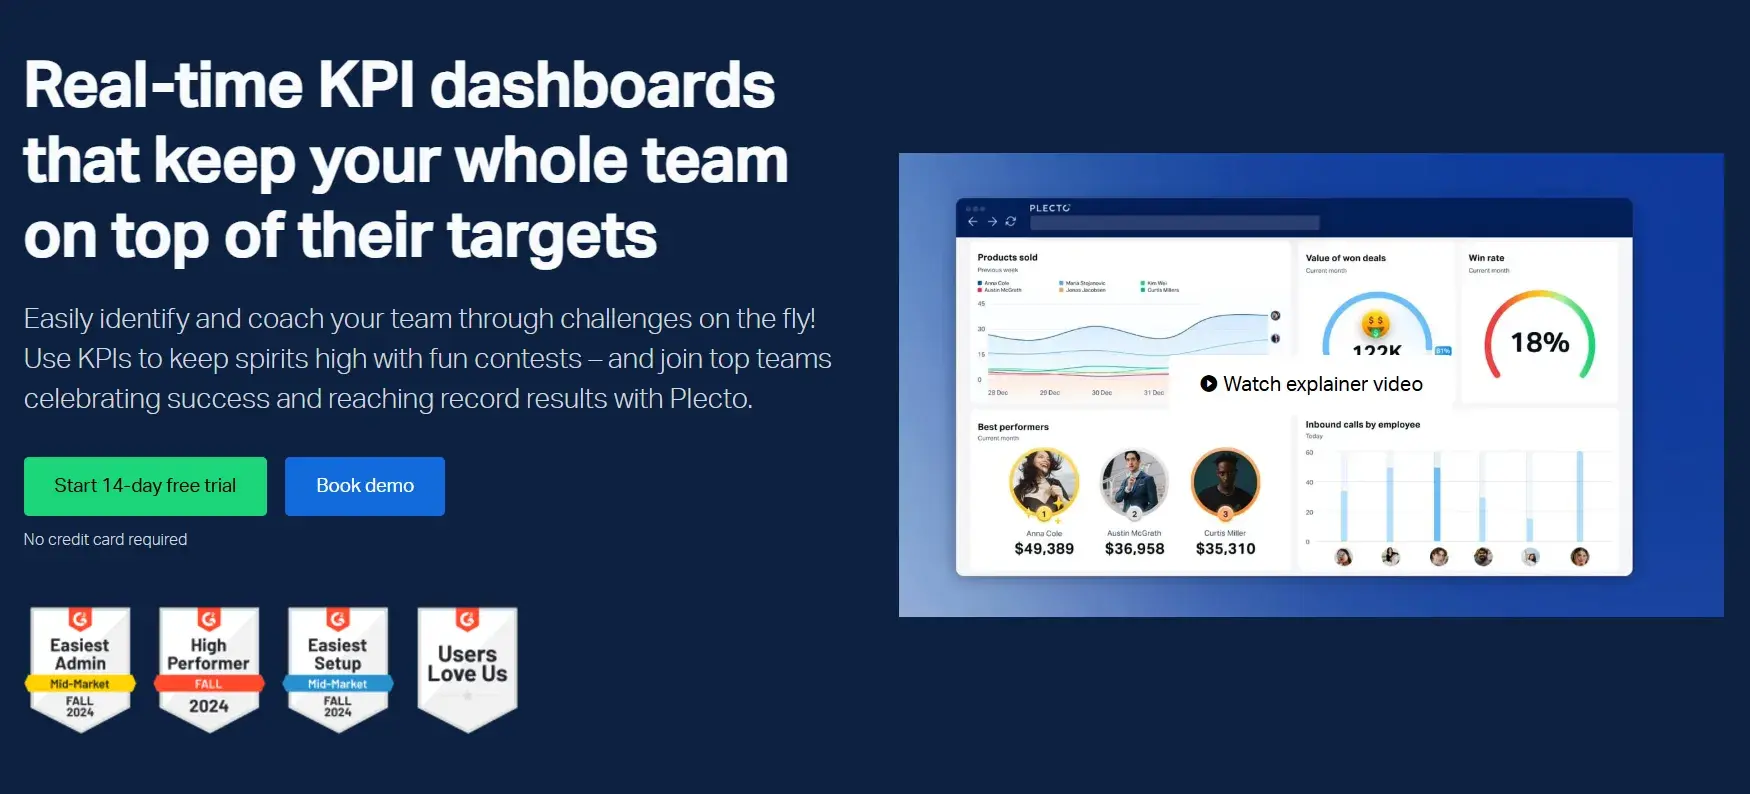
Best for: Keeping your team on top of goals and targets with dashboard data visualization software.
What I Like About Plecto
Plecto is an excellent tool for keeping your team focused and aligned. Here’s why I recommend it:
- Real-Time Data Insights. I really appreciate how Plecto pulls in data from an unlimited number of sources, giving real-time insights that help me stay on top of my goals and track progress seamlessly.
- Customizable Dashboards. Ability to filter across various sources and tailor the dashboard to showcase the metrics that matter most to me.
- Gamification for Motivation. Plecto’s gamification features are fantastic for boosting team engagement. Adding some friendly competition can serve as a motivation for the team to stay focused on targets and achieve goals faster.
- Goal-Focused Visuals. The ability to display goal-tracking data on interactive dashboards makes it easy for everyone to see where we stand and what needs more attention.
Price
Plecto offers three payment options depending on which plan you choose:
- Medium - $230
- Large - $355
- Enterprise - Custom
The pricing reduces when you opt for the yearly billing option.
17. Adverity
Best for: Automating data integration across hundreds of sources.
What I Like About Adverity
Adverity is a go-to marketing data analytics tool for the following reasons:
- Eliminates Data Silos. It helps break down data silos by centralizing marketing data, making it accessible for everyone on my team. This ensures that we’re all looking at the same information when making decisions.
- Augmented Analytics Powered by AI. Adverity’s use of AI to detect trends and insights is a game-changer. It quickly identifies areas for improvement and highlights strengths, allowing me to focus on the right actions to drive results.
- Time-Saving Reports and Visualizations. With its automated reporting and data visualization features, Adverity removes the need for manual work, allowing me to generate and share detailed insights with ease.
If you’re looking to streamline your marketing data processes and make smarter, data-driven decisions, Adverity is definitely a tool worth considering.
Price
Adverity’s idea is that they don’t stick to rigid pricing plans. For each customer, the pricing is different, so you’re prompted to fill out a form to get a custom quote.
Content Performance: What I Recommend You Focus On
When measuring the performance of your content, I suggest going through the following steps:
- Decide which performance indicators you're going to measure.
- Track those metrics and KPIs.
- Analyze and apply your findings.
Content Performance Indicators
With so many performance indicators available, I focus on figuring out which ones matter most for my goals. Here is a list of indicators to choose from:
- Web Traffic. The amount of traffic you get on your website and individual pages.
- Page Views. The number of views a web page gets from visitors.
- Impressions. The number of times an ad or web page is displayed to an individual.
- Sessions. A group of actions an individual website visitor takes while on a website during a specific amount of time.
- Bounce Rate. The percentage of visitors who come to your website but don’t convert in any way — rather, they bounce from your site before taking action.
- Search Engine Optimization (SEO). Keyword and search engine results page (SERP) success and performance.
- Engagement. The number of interactions that your visitors have with your content (e.g., comments, shares, likes, forwards, subscriptions) and how long engagement lasts across those channels and web pages.
- Social Media Engagement and Interactions. Depending on your social media platforms, there will be specific metrics related to engagement and interactions on a post and/or piece of content that you can analyze (views, shares, comments, likes, etc).
- Lead Generation and Conversions. The number of acquired leads, conversions, and sales that result from your content (e.g., email sign-ups, blog subscriptions, CTA clicks, downloads, and product purchases).
- Brand Awareness. This reflects how your target audience discovers your brand, gains insight into your products, understands your mission, and connects with what you stand for.
To truly gauge brand awareness, I suggest taking a look at other metrics on this list such as page views, social media engagement (or simply using the process of social listening), downloads, video views, referrals, and resource/document reads or shares.
- Customer Loyalty. The amount of content that your current customers consume and/or engage with (e.g., if a current customer is a blog subscriber who receives articles in their email inbox weekly).
- Upsell/Cross-sell. Sales for new, additional, or upgraded products that you offer.
Apply Content Marketing Analytics to Grow Better
I find content marketing analytics tools are indispensable for refining and optimizing your content strategy.
They have the power to help your team understand the health of your strategy, audience behaviors, interactions, and progress to goals.
As a result, you’ll have the information you need to improve the customer experience, resonate with your audience through your content, and increase conversions.
I recommend you ensure that the content you create delivers real value.
Refine your SEO strategy with tools such as Moz and Semrush. Analyze customer engagement with tools like Buffer and Hotjar. Create dashboards to view your metrics and workflows to automate manual tasks using HubSpot.
The idea is not just to collect data but to turn it into actionable insights that can shape better decision-making and drive tangible results. Leverage these tools to fine-tune your approach and enhance the customer experience.
Editor's note: This post was originally published in June 2020 and has been updated for comprehensiveness.
Comments
Post a Comment